Real-life FEM: Using photoelasticity to measure stress in transparent materials
- Aug 7, 2022
- 4 min read
“Stress” is an abstract concept…what exactly does the ratio of force per unit area mean for a complicated specimen? Well turns out there is a method discovered over a century ago, called photoelasticity, that can help visualize and understand stresses in transparent materials.
In 1816, a scientist by the name of David Brewster saw colorful patterns appear in a heated glass plate when he shone polarized light through it. What he had discovered was that the material exhibited a double refractive index which caused the incoming light to scatter in two directions at once, resulting in colorful interference patterns on the plate. This phenomenon, called birefringence, was later confirmed by other scientists like Fresnel and Neumann on many transparent materials including clear jelly, crystals like quartz, and plastics like polyethelene and acrylic. Further experiments showed that the two outgoing rays at each point are polarized in the planes of the principal stresses. In other words, the colorful interference patterns that develop are actually proportional to the differences in principal stresses at each point! Hence this technique could be used to do the seemingly impossible: visualize stresses in the material, i.e., conduct real-life FEM.
To illustrate this method (now known as photoelasticity), I did a few experiments of my own with household items. Specifically I shone polarized light through various specimens using a polariscope, an optical device with a light source and linear polarizing filters oriented perpendicular to each other. By placing my specimen in between the polarizing filters, I could see residual stresses and stress concentrations which resulted from its manufacturing process. See for yourself:
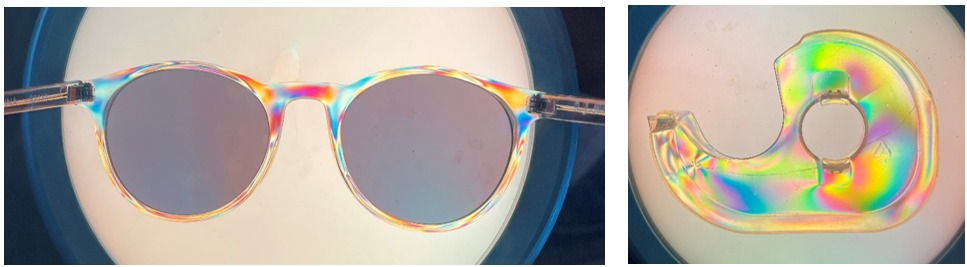
Residual stresses in (a) frame of my sunglasses and (b) plastic tape holder from its injection molding process.
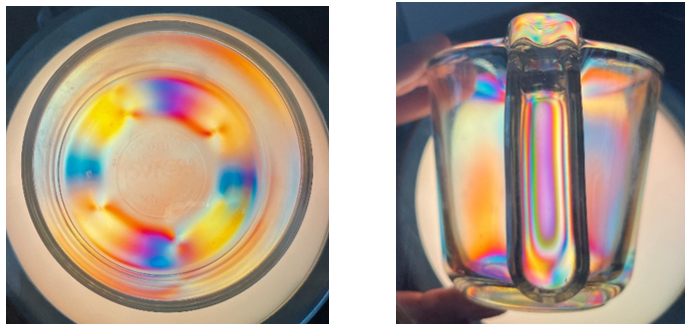
Residual stresses in (a) small glass bowl and (b) handle of a glass measuring cup from its molding process.

Residual stress at the bottom of (a) shot glass and (b) wine glass.

(a) Glass paperweight under normal light and (b) under a polariscope. The colors correspond to residual stresses from the glassblowing process (probably coolest picture I’ve ever taken).
What you are seeing here are visualizations of the residual stresses in the specimen, due to the birefringence of the glass or plastic material. To obtain quantitative stress results from the colors, we can use the fundamental equation of photoelasticity, called the stress-optic law:

For a 2D specimen under plane stress, this equation relates the difference in principal stresses with the fringe order N which can be computed from the colors of the pattern, a constant C which is specific to the transparent material, and the thickness h of the specimen. Hence this equation can translate the colors of the interference pattern into differences in principal stress. While the linearity of the equation falls apart for high stresses and varies with the wavelength of light used, the equation works well for elastic deformations and can be extended to 3D as well.
For my specimens, I could not easily use this equation since I did not know C for my material or how to calculate the fringe order N. However, I learned some rules of thumb for qualitatively converting the color patterns into stresses. First, the spacing of isochromatic fringes (i.e. lines of constant color) is generally inversely proportional to the magnitude of stresses. In other words, regions with closely-spaced fringes are regions of high stress. To verify this I did a small experiment. I put clear safety glasses under the polariscope and measured how the interference pattern changed when I flexed the two handles of the glasses. See for yourself how the fringe spacing decreases near the nose support, where stresses are highest:
The second rule of thumb is that parallel fringes represent constant bending moment in the specimen. I did not have a proper setup to demonstrate this, but I found a picture online of the fringe pattern in an acrylic beam under four-point bending. You can clearly see parallel fringes in the region between the central load application points, where the beam is subject to a constant moment:
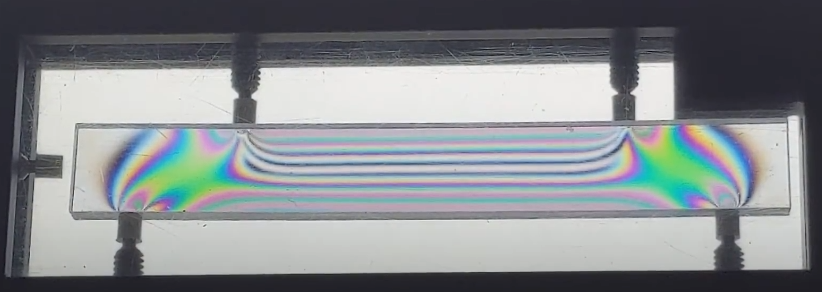
Credit: ME124 Materials and Mechanics Lab, University of Vermont
I did do some tensile tests under the polariscope with dogbone specimens cut from a polyethylene Ziploc bag. Both videos are 0.25x speed:
These amazing color patterns are caused by the tensile stress along the specimen length. It is especially cool to see how the fringe spacing decreases after necking begins near the left grip. The closer fringes mean higher stress, which makes sense due to the smaller cross section.
Besides these cool experiments, photoelasticity is actually regularly used today as an experimental stress analysis technique. Recently the field has become fully digital, with the use of advanced cameras and image processing methods. It is also no longer limited to transparent materials, as you can use photoelastic coatings to measure stresses on the surface of any complex component (even during its service life!). What's more, photoelasticity and polariscopes are even used to identify and verify expensive gemstones are real. If David Brewster were alive, he would certainly be surprised to see all the applications of birefringence today.
References/further reading:
"Digital Photoelasticity: Principles, Practice and Potential" by E.A. Patterson (https://doi.org/10.1046/j.0039-2103.2002.00004.x)
Digital Photoelasticity: Advanced Techniques and Applications by K. Ramesh
Experimental Stress Analysis by Dally and Riley
http://gemologyproject.com/wiki/index.php?title=Polariscope
https://www.youtube.com/watch?v=BdSaA9byKms
https://www.youtube.com/watch?v=5mvATvu5WIM


Comments